RIO-IFDM
How are the RIO-IFDM maps made?
The RIO-IFDM maps show the result of a coupling of two data sources:
- the interpolation of air quality measures (RIO interpolation model).
- the calculation of air quality based on meteorological data and the emission of air pollutants (bi-Gaussian dispersion model IFDM).
On this page both models are discussed and both the advantages and limits of the RIO-IFDM combination are highlighted.
RIO model: interpolation air quality measurements
The air quality in Belgium is measured via fixed measuring stations spread over the whole territory. These measurements are done with automatic measuring devices, which results in a very accurate image of the air quality at these specific locations. However, since it is impossible to measure everywhere, computer models are used to estimated the air quality in those locations where measurements are not carried out. The RIO model is such a computer model that calculates the concentrations of a number of air pollutants.
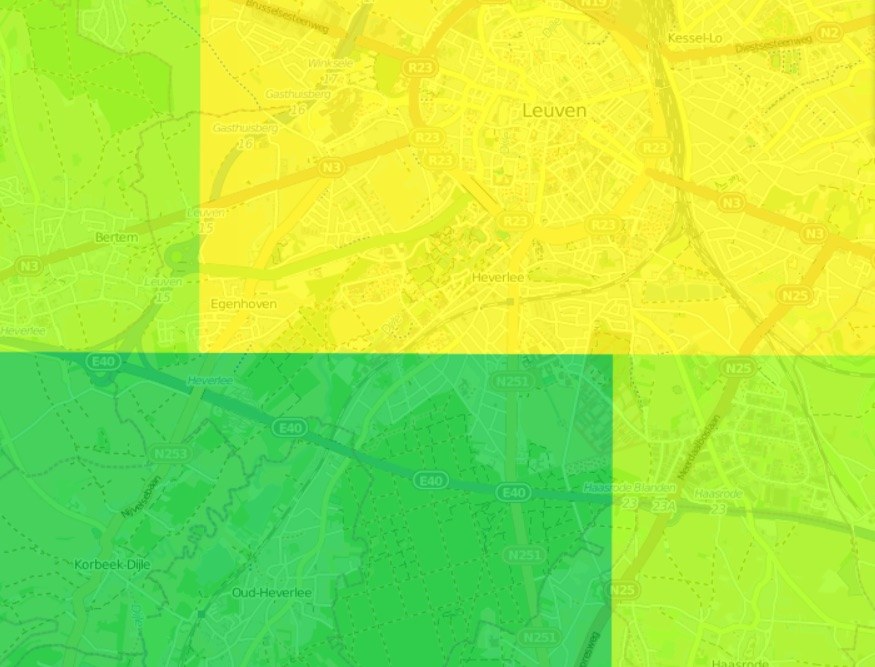
RIO is a so-called interpolation model. It uses the available measurements from the fixed measuring stations and interpolates them in a 'smart' way. Smart, because RIO also takes into account information on land use. A relation between land use and the level of air pollution surely exists. In cities, thus areas with numerous inhabitants and a lot of traffic, there is more air pollution than in forested areas. With RIO, an estimated of 'background concentrations' can be made for areas of 4x4 km². Within such a 4x4 km² grid cell however, RIO cannot distinguish between for example smaller forested areas and more urbanised areas or places with much traffic. In other wordes: per 4x4 km² grid cell exactly one mean concentration can be calculated.

An example of a RIO 4x4 km² map (zoom on Leuven).
To make more detailed air quality information available within a 4x4 km³ grid cell, the RIO interpolation technique is combined with the IFDM model.
IFDM model: calculation of air quality
IFDM calculates the impact of emissions of point and line sources on the air quality in the direct surroundings of those point and line sources. One example of a point source might be a factory chimney, while a line source constists of the emissions originating from the traffic on a road or part of a road.
The exact location of the most important industrial sources and the amount of air pollution emitted is known. Via traffic counts and the average vehicle fleet composition, the traffic based emissions can also be estimated per road (segment). This emission per road (segment) is known for the important urban and regional roads in addition to the highways and ringroads.
In the actual version of IFDM only traffic based and industrial sources are being modelled. Other sources of air pollution, such as agriculture and households are not seperately modelled, but are included in the RIO 4x4 km² 'background'. In contrast with point and line sources, these agriculture and household based emissions are more spread out over larger areas.
To avoid industrial and traffic based sources being calculated twice, a 'double counting correction' is applied. The RIO 4x4 km² results, which are the results of interpolated measures, do after all contain the contributions of all sources.
Unlike the RIO model, the IFDM model does not use measurements, but instead calculates the pollutant concentrations based on emission data and meteorological data such as wind speed, ind direction and temperature. Surely, these meteorological data influence the way the pollutants are spread. For some substances, such as nitrous dioxide (NO2) or ozone (O3), chemical in the atmosphere also play a role. The speed of these chemical reactions is for instance influenced by temperature.
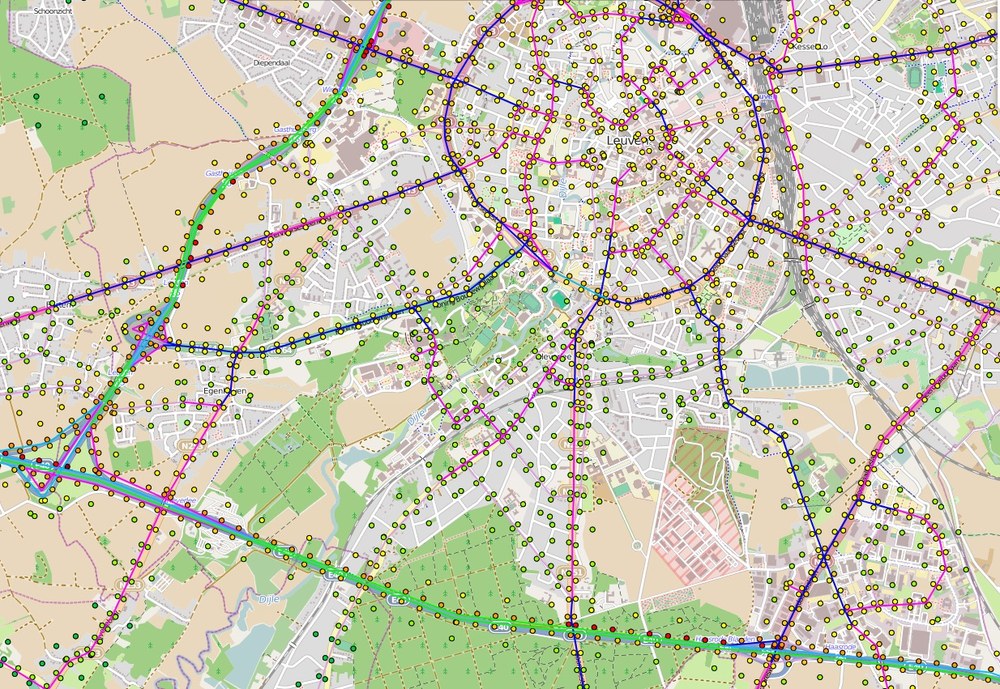
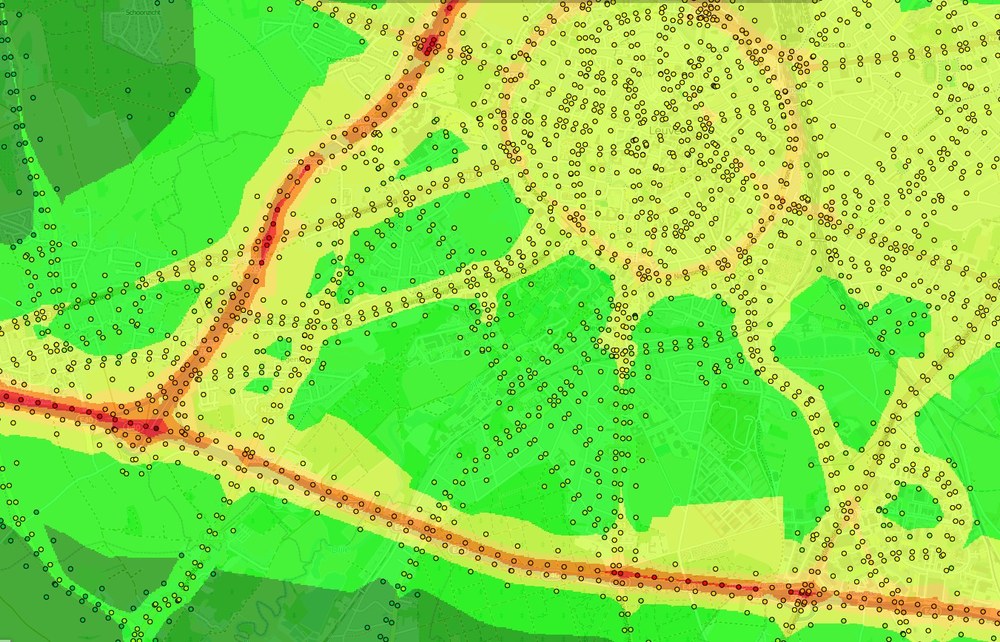
IFDM calculations are carried out for more than 1 million points all over Belgium, alongside roads and near industrial sources. Alongside the most important sources concentrations are calculated at a variable distances. Via a further operation (interpolation) a more detailed concentration map is achieved.

IFDM- calculation for the vicinity of Leuven.

Combination of RIO-IFDM for the vicinity of Leuven.
Reliability of the RIO-IFDM combination?
From a first series of validation exercises it seems RIO-IFDM is able to estimate the concentrations in a reliable way. Validation happens through a comparison of model results with measured values. An overview of the validations that have already been carried out can be found in the ATMOSYS validation report of Lefebvre and Vranckx. An other validation report, investigating the reliability of RIO-IFDM for NO2 concentrations, can be found here.
The RIO-IFDM model is also continuously being improved and refined based on new scientific insights.
Advantages of RIO-IFM
The main advantage of the RIO-IFDM combination is the higher spatial resolution on which air quality can be assessed. This allows for the population to be informed about air quality in a better way. Additionally the exposure of the Belgian people and the influence on health can be monitored on a more detailed and correct level. This kind of calculations are certainly not without importance as one of the goals of the European air quality policy is a reduction with approximately 50% of the health impact by 2030 (New Air Quality Package, A Clean Air Programme for Europe, see: //ec.europa.eu/environment/air/clean_air_policy.htm).
Another advantage is that RIO-IFDM allows a better mapping of problem areas, i.e. areas where for example the EU treshold values are exceeded. This allows policy makers to take more focused actions to improve the air quality.
Limits of RIO-IFDM
The air quality calculated with RIO-IFDM for a certain location is the best possible approximation of reality, yet it is subject to uncertainties. In every location, the calculated value can be higher or lower than the actual (although unknown) concentration. This is inherent to air quality models. The uncertainties of model calculations are larger than those of measurements most of the time.
The RIO-IFDM model combination also has a number of limitations:
- RIO-IFDM is an 'open street' model, which means it does not take into account obstacles (such as trees, accoustic barriers, rows of houses...) alongside roads where traffic impact is being calculated. Likewise, the topography of these roads (for example a road situated in a vale) is not considered. This means RIO-IFDM will probably underestimate the concentrations in narrow streets with a lot of traffic in big inner city areas (so-called street canyons). In these streets, air pollution can be dilluted less between all those obstacles. To also take this into account, the RIO-IFDM model is further combined with a street canyon model that requires very detailed information of the street configuration (See ATMO-Street).
- No information is available on traffic based emissions on the smallest roads and/or roads with very little traffic. Traffic (and its accompanying emissions) on these roads can be assigned to the larger roads to which they connect. The calculated concentrations on these larger roads might thus be slight overestimations, while those on the smaller roads might me slight underestimations;
- The location of the line sources does not always fit perfectly with the exact location of the corresponding road. When a line source is moved a couple of meters in comparison with the exact location of the road, this also results in a shift of the spatial distribution of the concentrations calculated with IFDM;
- Traffic counts concerning Flanders are retrieved from the'Vlaams Verkeerscentrum' (VVC). For the Brussels and Walloon area, the censuses of the federal civil service of mobility (FOD Mobiliteit) are used. These latter traffic censuses of the FOD Mobiliteit are available for a smaller number of roads than those of the VVC. Therefore traffic emissions in Wallonia and Brussels can be distributed less across all roads. This eventually leads to higher uncertainties on the modelled concentrations in these areas in comparison with those in Flanders.
More specialised information can be found in the following reports and scientific articles:
-
- Janssen et al., 2008, “Spatial interpolation of air pollution measurements using CORINE land cover data”, Atmospheric Environment 42 (20) 4884–4903
-
- Lefebvre et al.,2013 ”Presentation and evaluation of an integrated model chain to respond to traffic- and health-related policy questions”, Environmental Modelling & Software 40 160- 170
-
- Lefebvre W., Vranckx S.,2013 “Validation of the IFDM model for use in urban applications”
