PM₁₀ daily mean
PM10 annual mean | PM10 daily mean | PM2.5 annual mean
All data below are the result of the RIO interpolation technique, in which the measurement observations are interpolated to a 4x4 km² grid resolution. Locally, concentrations can be higher or lower.
Evolution of the percentiles
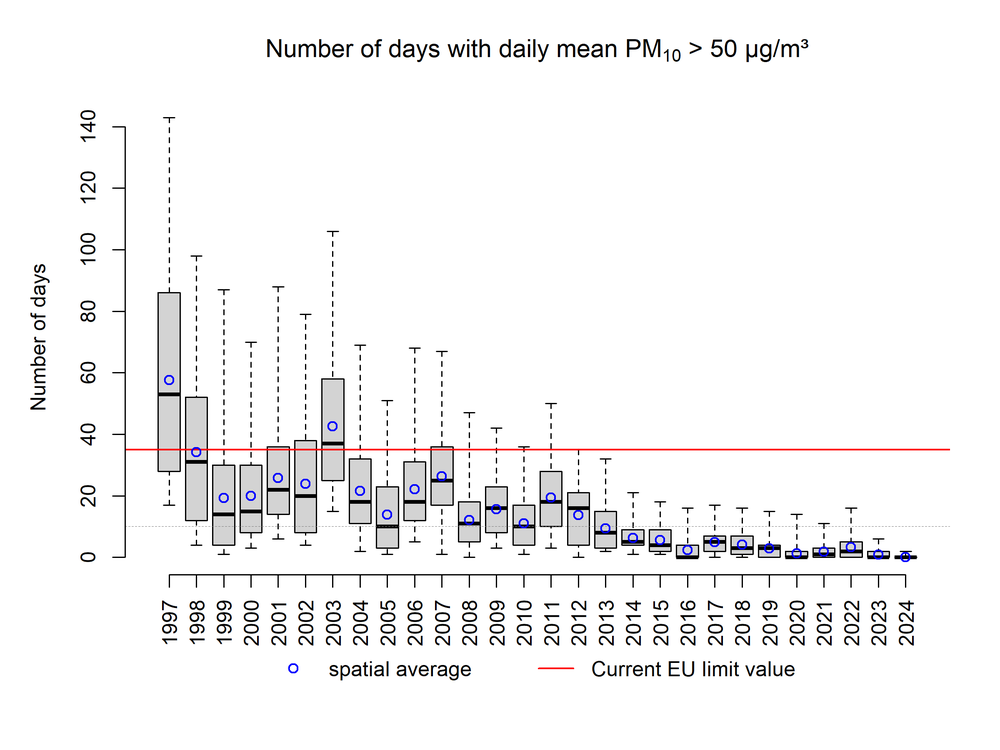
The figure below uses box plots to show the evolution of the minimum, the 25th percentile (P25), the 50th percentile (P50), the 75th percentile (P75) and the maximum of the number of days per year where the daily mean PM10 concentrations exceeded 50 μg/m3 in Belgium. The spatial avarage is represented by the blue circles. In 2024, the maximum exceedance days in Belgium amounted to 2. A downward trend can be observed in the number of exceedance days in Belgium since 1997, which indicates that the measured decline in emissions of primary particulate matter and particulate matter precursors has a positive effect on the number of exceedance days. The European limit value of 35 days which should already have been attained by 2005 was still being exceeded in 2012. The more stringent WHO guideline value of 3 exceedance days per year of daily mean PM10 concentrations of 45 µg/m³ is also achieved across the entire Belgian territory in 2024.

Box plot of the number of days per year where the daily mean PM10 concentrations exceeded 50 μg/m³. The spatial average is represented by the blue circles. All data were calculated using the RIO interpolation technique.
Click here for more information how to interpret a boxplot.
Evolution of regional averages
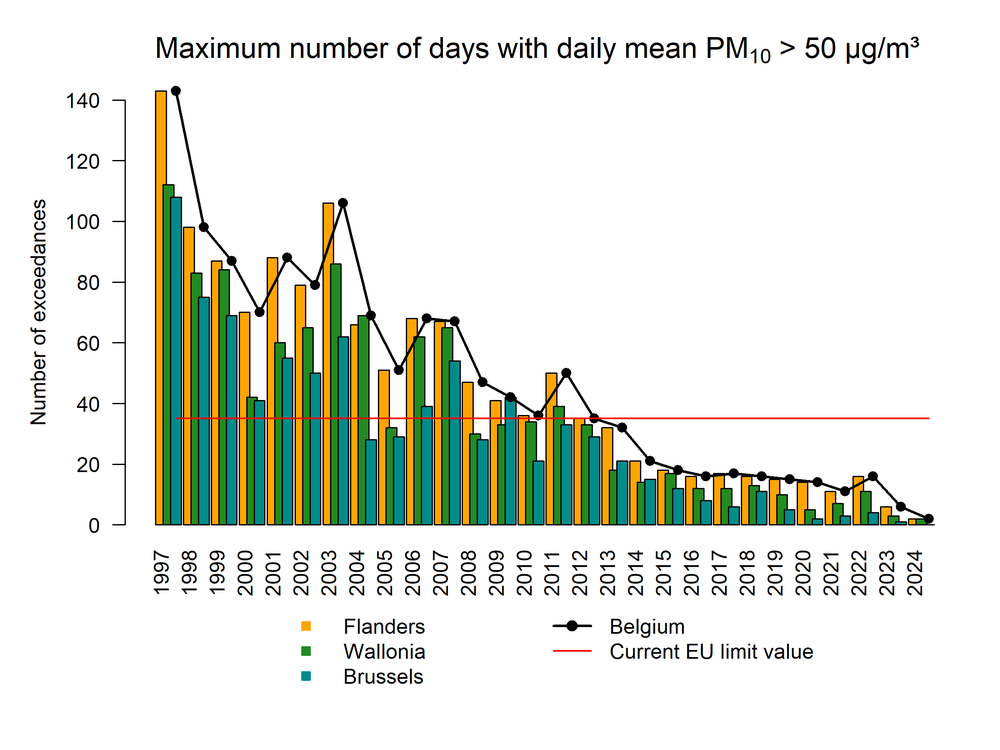
The downward trend in the number of exceedance days since 1997 is observed for the three regions. In 2024, the maximum number of days where the daily mean limit value was exceeded in the Flemish, Walloon and Brussels-Capital Regions amounted to 2, 2 and 0 respectively.

Evolution of the maximum number of days per year where the daily mean PM10 concentration exceeded 50 μg/m³ in Belgium and the three Regions. All data were calculated using the RIO interpolation technique.
Spatial trends
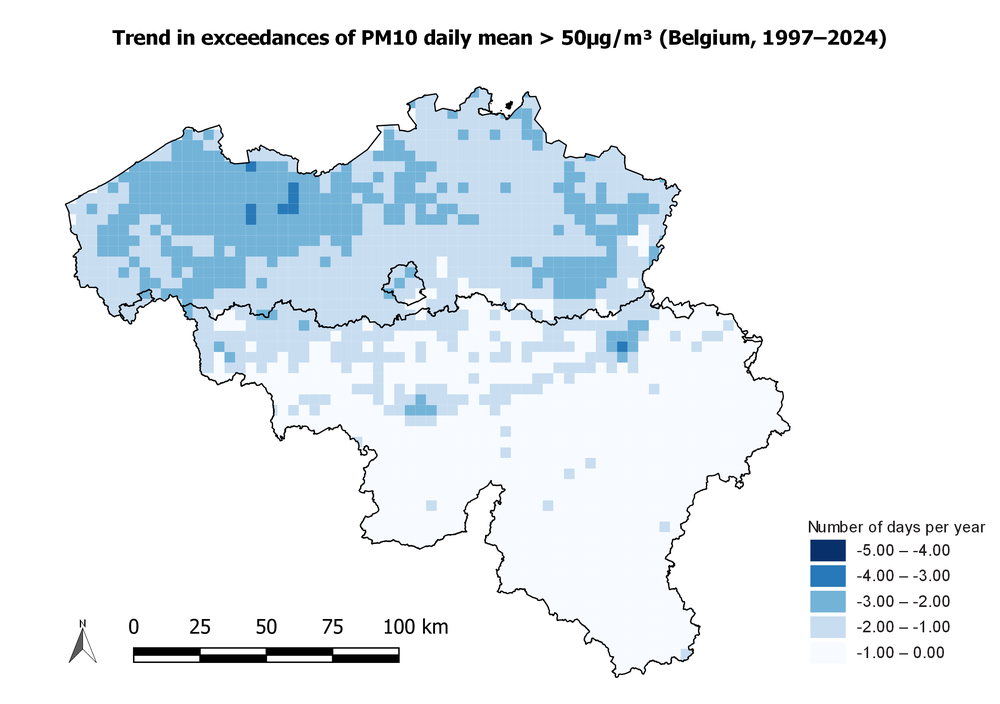
The figure below shows the spatial distribution of the trend in the number of days with daily mean PM10 concentrations above 50 μg/m³ over the period 1997–2024. The largest decrease occurs north of the rivers Sambre and Meuse. On average, the decrease in the number of exceedance days was more limited, but a downward trend can be observed.

Spatial trend of the number of days with daily mean > 50 μg/m³ over the period 1997–2024 (number of days/year). All data were calculated using the RIO interpolation technique.
