PM₂.₅ annual mean
PM10 annual mean | PM10 daily mean | PM2.5 annual mean
All data below are the result of the RIO interpolation technique, in which the measurement observations are interpolated to a 4x4 km² grid resolution. Locally, concentrations can be higher or lower.
Evolution of the percentiles
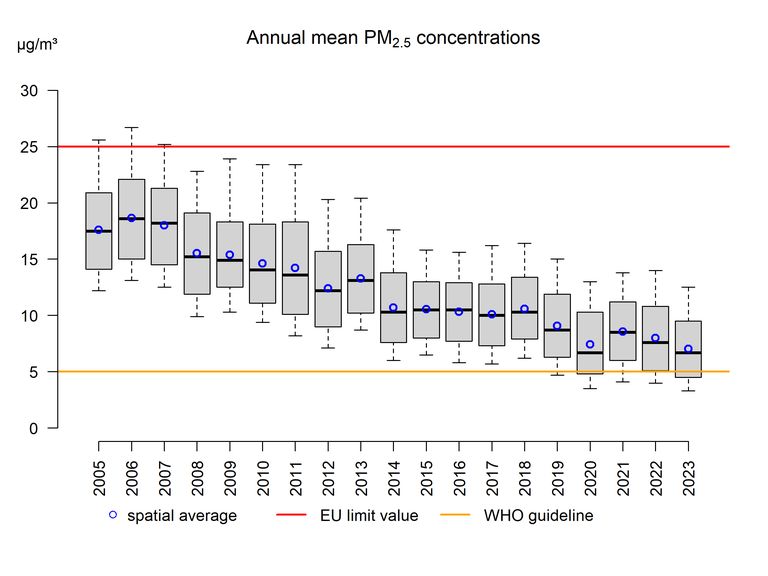
The figure below uses box plots to show the evolution of the minimum, the 25th percentile (P25), the 50th percentile (P50), the 75th percentile (P75) and the maximum annual mean PM2.5 concentrations in Belgium. The spatial average is represented by the blue circles. The spatially averaged PM2.5 concentrations as well as the percentiles have shown a downward trend since 2006. However, this trend seems to have flattened out between 2014 and 2018. Since 2018, a downward trend is again noticeable with a spatial average falling below the value of 10 µg per m³. In 2023, annual mean PM2.5 concentrations above the WHO guideline of 5 µg/m³ were still recorded in 64 % of the grid cells.

Box plot of annual mean PM2.5 concentrations (μg/m³) over the period 2005–2023. The spatial average is represented by the blue circles. All data were calculated using the RIO interpolation technique.
Click here for more information how to interpret a boxplot.
Evolution of regional trends
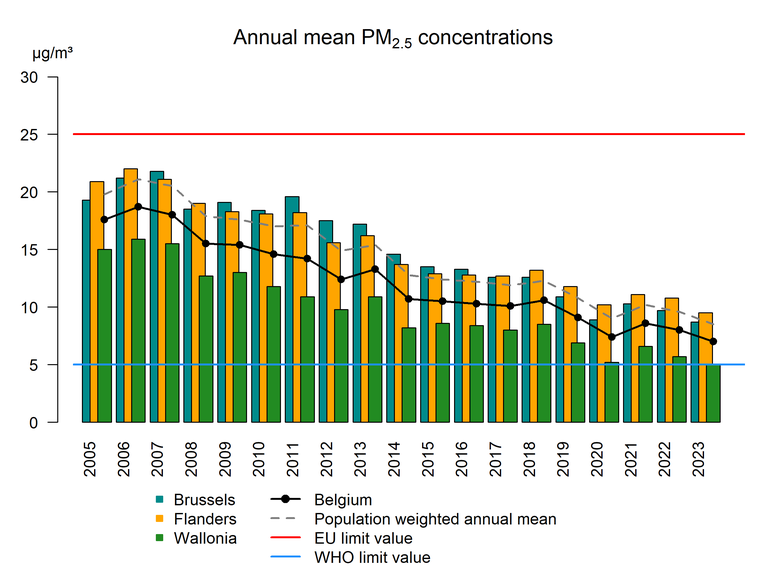
The spatially averaged annual PM2.5 concentrations for Flanders, Wallonia and Brussels were 9.5, 5.0 and 8,7 µg/m³ respectively in 2023. Since 2006, the PM2.5 concentrations have decreased in all regions, although this tendency leveled out between 2014 and 2018. In 2023 the population weighted annual mean concentration was 8.5 µg/m³: in areas with a dense population, the annual mean concentrations are higher.

Evolution of the spatially averaged annually mean PM2.5 concentrations for the three Regions and Belgium, and of the population-weighted annual mean concentration for Belgium. All data were calculated using the RIO interpolation technique.
Spatial trends
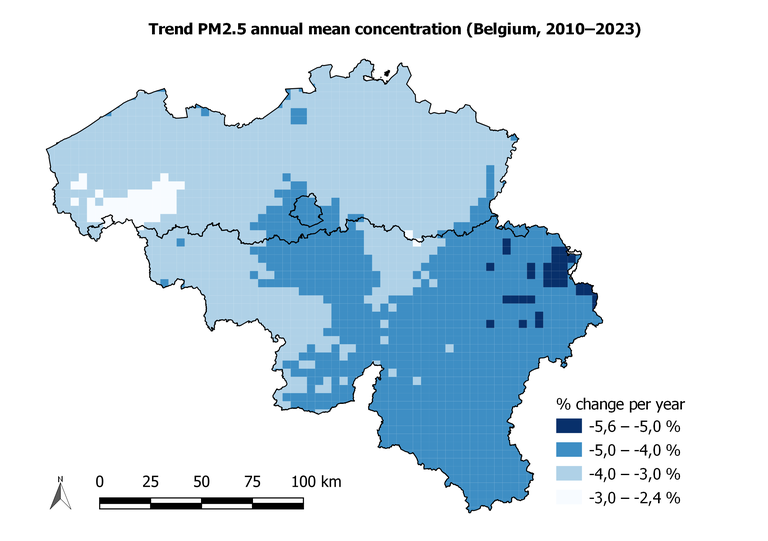
PM2.5 annual mean concentrations in Belgium decreased between 2010 and 2023. The map below shows that the relative decrease is greatest in the south of the country and around the cities of Antwerp, Brussels and Liège, in those locations there was an annual reduction of 4 % or more.

Spatial trend in annual mean PM2.5 concentrations (% per year). All data were calculated using the RIO interpolation technique.


