New BelAQI index
Introduction
For the assessment of air quality in the short term (daily/hourly) in a non-technical manner, an air quality index is used. An air quality index aggregates the concentrations of various pollutants in the ambient air into a single representative value. Since 1 August 2017, the three regions in Belgium have been using the BelAQI index.
BelAQI till November 2022
The basis for the BelAQI index that was used till November 2022, were the WHO guidelines and interim targets for PM2.5 from 2005. More information on the BelAQI index used till November 2022 can be found here: https://www.irceline.be/en/air-quality/measurements/belaqi-air-quality-index/information
New BelAQI
In September 2021, the WHO published new, more stringent, guideline values for both the long and short term. Along with the stricter guideline values, new interim targets and relative risks (RR) were also published: see https://www.ncbi.nlm.nih.gov/books/NBK574591/
It is therefore necessary to adjust the BelAQI index scales according to the new guideline values, interim targets and relative risks.
Furthermore, it is appropriate to stop using 24-hour averages for particulate matter (PM2.5 and PM10) for the current index and switch to hourly average concentrations. Indeed, the use of 24-hour averages has the disadvantage that a rapid increase (and rapid decrease) in concentrations is not immediately visible in the index. Therefore, it makes more sense that "current" air quality is based on the most recent (hourly average) concentrations rather than the average concentrations for the past 24 hours. One difficulty, however, is that WHO has no hourly average guideline values for particulate matter. This is also the case for NO2 since the revision to the WHO guideline values. The new WHO guideline value for NO2 is also a 24-hour average (note: the old hourly average NO2 guideline value remains valid, although it was based on indoor air quality studies at the time)
In order to use hourly average concentrations for PM2.5, PM10 and NO2 for the current index, the relationship that exists between daily average and daily maximum hourly average concentrations will be used. For O3, the same methodology as for the formulation of the current BelAQI index, namely the relationship between maximum 8-hour and 1-hour average concentrations, can be used (see below).
The index for prior days and the forecasted index is calculated using the daily mean (PM2.5, PM10 and NO2) and daily highest 8-hour average (O3) concentrations.
New index scales based on the new WHO 2021 guideline values and interim targets
For the new BelAQI index, the 2021 WHO annual limit (summer mean for ozone), daily limit (max 8 hours for ozone) and the interim target 2 for the individual pollutants are fixed on the same index. The BelAQI becomes at least index 3 as soon as the annual limit for PM2.5, PM10 and NO2 or the summer average for O3 is exceeded. If the WHO daily limit for PM2.5, PM10 and NO2 or the max-8 hourly average for O3 is exceeded, the index becomes at least 6 (Poor)
For PM2.5, PM10 and NO2, the highest index (10) is reached as soon as the interim target 2 is exceeded. For ozone the index will be 8 when the interim target 1 (160 µg/m³ as max 8-hourly average) is reached. A max-8 hourly average of 160 µg/³ corresponds to the EU information threshold of 180 µg/m³ as an hourly value. The concentration classes for the other index classes are further completed in a pragmatic manner. This approach then leads to the index classes as presented in Table 1.
|
Index |
Classification |
PM10 |
PM2.5 |
O3 |
NO2 |
|
|
1 |
Excellent |
0 - 5 |
0 – 2.5 |
0 - 30 |
0 - 5 |
|
|
2 |
Very good |
6 - 15 |
2.6 – 5.0 |
31 - 60 |
6 - 10 |
|
|
3 |
Good |
16 - 25 |
5.1 – 7.5 |
61 - 70 |
11 - 15 |
> WHO annual limit/summer average (O3) |
|
4 |
Fairly good |
26 - 35 |
7.6 - 10 |
71 - 80 |
16 - 20 |
|
|
5 |
Moderate |
36 - 45 |
11 - 15 |
81 - 100 |
21 - 25 |
|
|
6 |
Poor |
46 - 60 |
16 - 25 |
101 - 130 |
26 - 30 |
> WHO daily limit/max8h (O3) |
|
7 |
Very poor |
61 - 70 |
26 - 35 |
131 - 160 |
31 - 35 |
|
|
8 |
Bad |
71 - 80 |
36 - 40 |
161 - 190 |
36 – 40 |
> WHO Interim target 2 O3 |
|
9 |
Very bad |
81 - 100 |
41 - 50 |
190 - 220 |
41 - 50 |
|
|
10 |
Horrible |
>100 |
>50 |
>220 |
>50 |
> WHO Interim target 2 PM2.5,PM10,NO2 |
table 1: New BelAQI daily index classes based on the new WHO advisory values
The advantage of this method is that the choice of an index class can be directly linked to the WHO guideline values (for both short and long-term). After all, air quality becomes poor as soon as the WHO daily limits (max 8-hour average for ozone) are exceeded. The disadvantage compared to the current BelAQI is that, for the same index, the impact on premature mortality is no longer (completely) synchronous (see figure 1). Figure 1 shows the increase in daily mortality by index class (relative to index 3). Starting with index 3, concentrations become higher than the WHO annual advisory value (PM2.5, PM0 and NO2) or summer average (O3). According to the WHO the short-term effects on mortality are not significant when the daily average / max-8 hourly average concentrations are lower than the annual advisory values / summer average. Thus, this means that, for index 1 and 2, there is no (significant) increase in mortality.
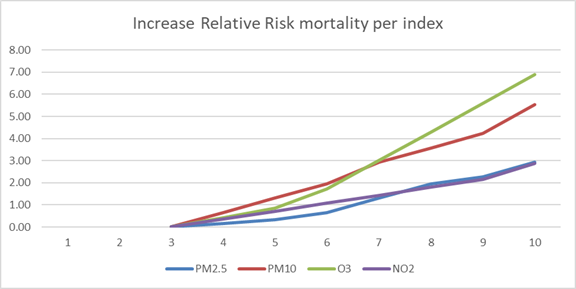
Figure 1. Increase in daily mortality (%) per increase in a (sub)index class
Figure 1 also shows that, for NO2 and PM2.5, the increase in daily mortality by (sub)index is almost synchronous. Thus, an equal (sub)index for PM2.5 and NO2 provides a similar impact on the daily increase in mortality. For O3 and PM10, the impact is higher at the same (sub)index. It can be noted, however, that the difference is small: at (sub)index 8 for PM2.5 or NO2, the increase is about 2%, for PM10 3.5% and for O3 4%. The non-synchronous increase in daily mortality per pollutant need not be an argument against this new approach.
This new index classification based on the daily average PM2.5, PM10 and NO2 concentrations and the max 8-hourly daily average for O3 will be used to determine the air quality index for the past few days and for forecasting the next few days.
Index scales for current air quality based on hourly average concentrations
As already mentioned earlier, the current BelAQI air quality index is based on the most recent running 24-hour average concentrations available for PM2.5 and PM10 and most recent hourly average concentrations available for NO2 and O3. For PM2.5 and PM10, the most recent index in a day is based on the average concentrations for the past 24 hours. The disadvantage of the use of 24-hour averages is that a rapid increase (or rapid decrease) in concentrations does not immediately cause an increase (or decrease) in the index. The hourly average concentrations can be very high, while the air quality index will still indicate "good" air quality for several hours. Conversely, air quality will be classified as "poor" at the end of a smog episode when hourly average concentrations have already dropped significantly.
Because the WHO has no advisory values for hourly average concentrations, an hourly index based on hourly average concentrations is not a simple matter to determine. In order to resolve this, the relationship between the highest hourly average concentrations in a day and the daily average (max 8-hours per day for O3) is calculated for a "virtual" (Belgian) telemetric monitoring station and for all the days in the period 2017-2019.
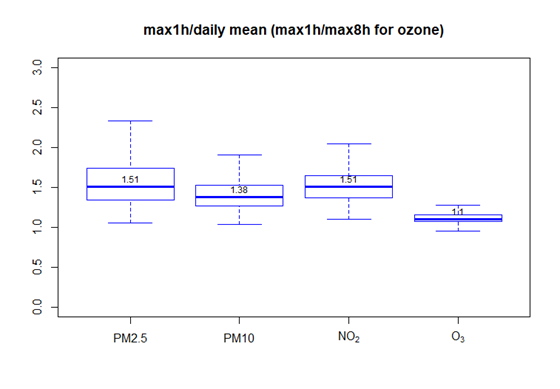
Figure 2: Box plot showing ratio of max-1h/day average concentrations (max 8h for ozone) per pollutant for a Belgian virtual telemetry station (all the days in the period 2017-2019).
The median ratio of maximum hourly average to daily average (max-8 hours for O3) concentrations for all the days in the period 2017-2019 is as follows:
PM2.5: 1.51
PM10: 1.38
NO2: 1.51
O3: 1.10
This ratio is used to establish BelAQI hourly concentration classes for the various pollutants by multiplying the daily index concentration classes (table 2) by these ratios. This then leads (rounded) to the classes in Table 2.
|
Index |
Classification |
PM10 |
PM2.5 |
O3 |
NO2 |
|
|
1 |
Excellent |
0 - 11 |
0 – 3.5 |
0 - 30 |
0 - 10 |
|
|
2 |
Very good |
11 - 20 |
3.6 – 7.5 |
31 - 65 |
11 - 15 |
|
|
3 |
Good |
21 - 35 |
7.6 – 10 |
66 - 75 |
16 - 20 |
|
|
4 |
Fairly good |
36 - 45 |
11 - 15 |
76 - 90 |
21 - 30 |
|
|
5 |
Moderate |
46 - 60 |
16 - 20 |
91 - 110 |
31 - 40 |
|
|
6 |
Poor |
61 - 80 |
21 - 35 |
111 - 150 |
41 - 45 |
|
|
7 |
Very poor |
81 - 95 |
36 - 50 |
151 - 180 |
46 - 50 |
|
|
8 |
Bad |
96 - 110 |
51 - 60 |
181 - 210 |
51 – 60 |
> O3 information threshold |
|
9 |
Very bad |
111 - 140 |
61 - 75 |
211 - 240 |
61 - 75 |
|
|
10 |
Horrible |
>140 |
>75 |
>240 |
>75 |
> O3 alert threshold |
table 2: BelAQI hourly index classes based on the relationship between max 1-hour and daily average (max 8-hour for O3) concentrations.
The intention is to use this BelAQI hourly index for, among other things, the BelAIR app.
Frequency distribution for the new BelAQI index in 2021
Figure 3 shows the frequency distribution (%) for the daily index for 4 monitoring stations in 2021. The figure shows on how many % of the days in 2021 a BelAQI index occurred. In urban and traffic environments, not unexpectedly, the index is in the higher ranges on more days. At the Ardennes monitoring station, also not unexpectedly, the index is situated in the lower index classes. The index at the urban station in 2021 was higher or equal to 6 (poor) for 54% of the days and higher or equal to 8 (bad) on 21% of the days. At the coastal monitoring station, the figures are 18 and 0%, respectively. At the Ardennes monitoring station, 8 and 0%, respectively.
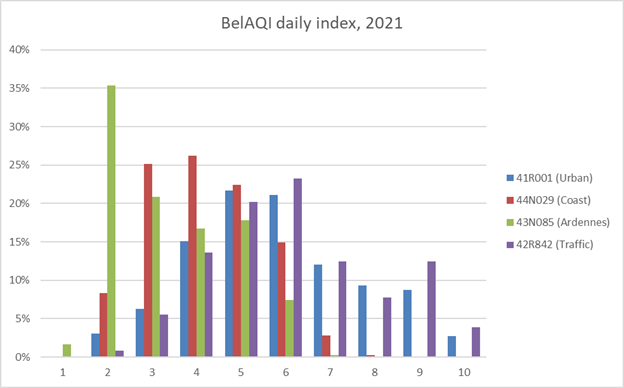
Figure 3: frequency distribution for the new BelAQI index at 4 monitoring stations (urban Brussels, national Coast, Ardennes and traffic).
Conclusion
This paper proposes the introduction of a new BelAQI index. This new index is based on the new WHO (2021) guideline values. In addition to an index used to classify the air quality in the past few days and for the next few days, an hourly index is also proposed that can be used to assess the current air quality based on the latest available hourly values. The hourly index avoids discussions about the BelAQI index being too slow to respond to increasing or decreasing air pollutant concentrations.