History
PM10
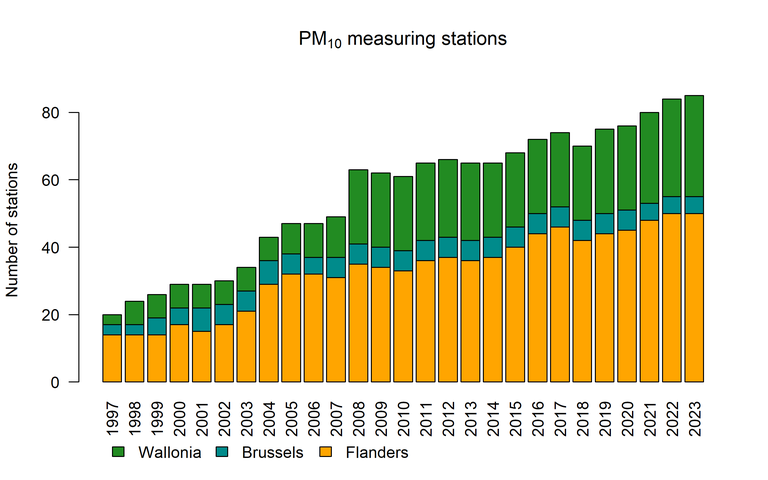
Evolution of the number of monitoring stations where PM10 is measured, including both the telemetric stations and the stations used in specific studies. The number of PM10 monitoring stations in Belgium has risen from 20 in 1997 to 85 in 2023. Because the number of monitoring stations was considerably smaller in the first years, the uncertainty on the interpolated annual mean concentrations is greater in those initial years.
PM2.5
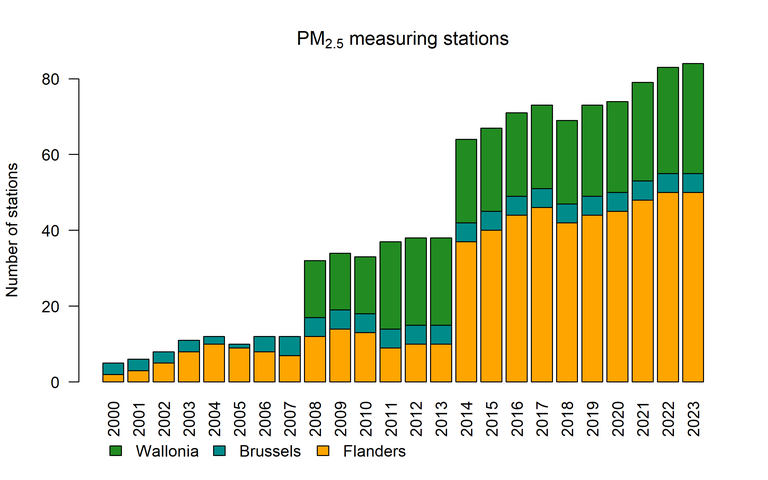
Evolution of the number of monitoring stations where PM2.5 is measured, including both the telemetric stations and the stations used in the specific studies. The number of PM2.5 monitoring stations has risen significantly from 5 in 2000 to 84 in 2023. Because the number of monitoring stations was substantially lower in the first years, the uncertainty on the annual mean values is greater in these initial years. This is especially true for Wallonia where PM2.5 was not measured before 2008.
BC
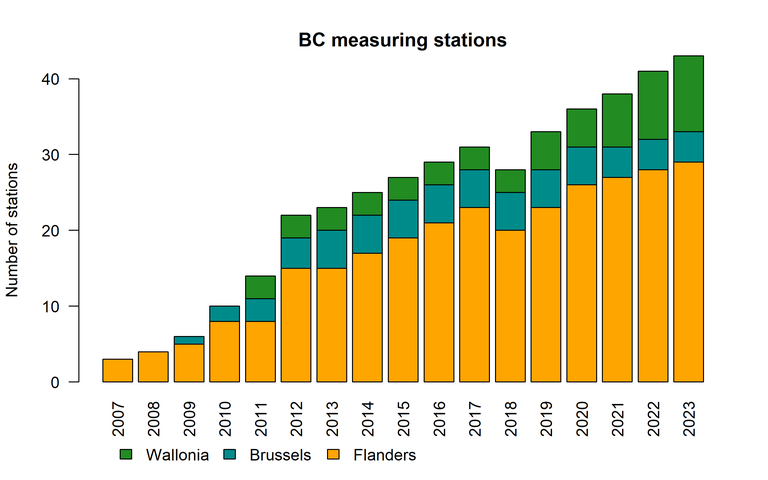
Evolution of the number of monitoring stations where BC is measured. In 2007, BC measurements were started at 3 monitoring stations in Flanders, in 2009 BC measurements were added in Brussels and since 2011 measurements have been carried out in all three regions. Due to the initial small number of measuring stations, the uncertainty on interpolated concentrations in those early years is high. Meanwhile, the number of monitoring stations increased to 43 in 2023.
Ozone
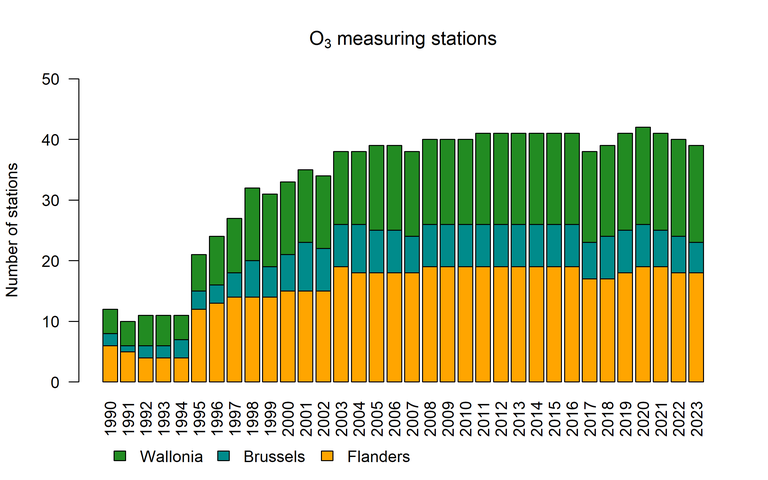
Evolution of the number of monitoring stations where ozone is measured, including both the telemetric stations and the stations used in specific studies. The number of ozone monitoring stations has risen from 12 in 1990 to 39 in 2023. Because the number of monitoring stations was initially significantly lower, the uncertainty of the interpolated annual averages is greater in the early years.
Nitrogen Dioxide
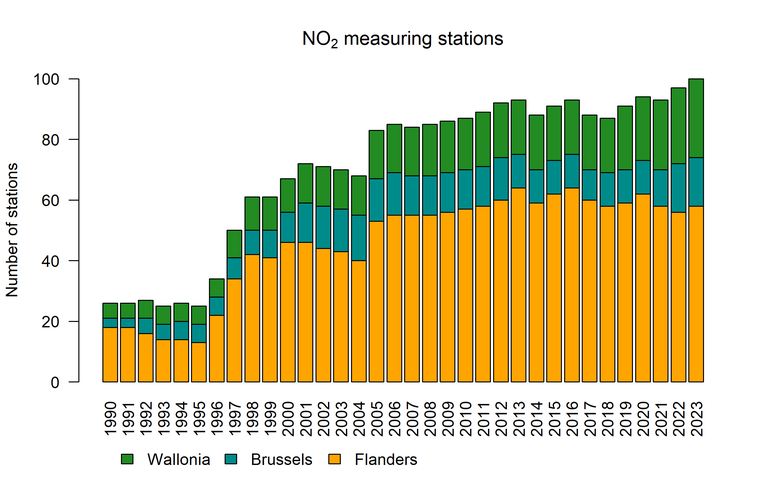
Evolution of the number of monitoring stations where NO2 is measured, including both the telemetric stations, stations used in specific studies and stations that are managed by the electricity producers and the Belgian Petroleum Federation in cooperation with the regional environmental administrations. The number of NO2 monitoring stations has risen from 26 in 1990 to 100 in 2023. Since the number of monitoring stations in the first years was substantially lower than more recently, the uncertainty on the interpolated annual mean concentrations is larger in those initial years.
Sulfur Dioxide
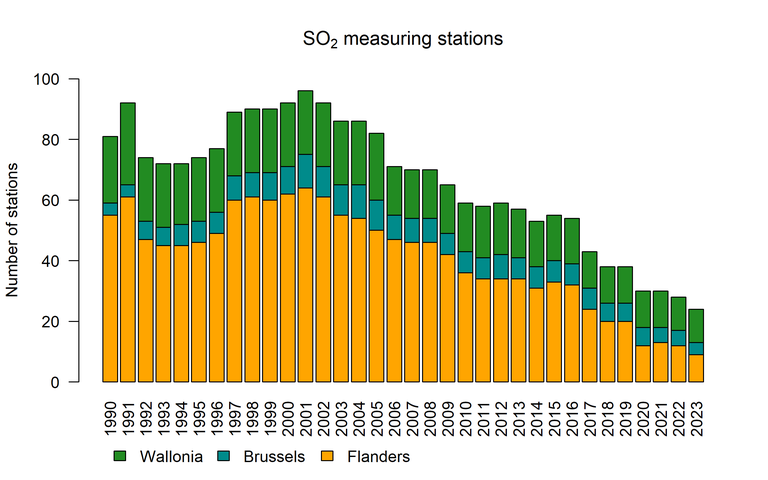
Evolution of the number of monitoring stations where SO2 is measured, including both the telemetric stations, stations used in specific studies and stations that are managed by the electricity producers and the Belgian Petroleum Federation in cooperation with the regional environmental administrations. The number of SO2 monitoring stations has dropped from 81 in 1990 to 24 in 2023. In the years with fewer monitoring stations, the interpolated values have a larger uncertainty.
