For each measuring site, the results are shown as a table (click on
 )
or as a graph per pollutant (click on
)
or as a graph per pollutant (click on
 ).
).NOTE: interpreting the measurements is not always straightforward. More information can be found at the bottom of this page.
During the Mobility Week, from 16 to 22 September 2026, various initiatives are being taken to promote
public transport and active mobility. On Sunday 20 September 2026, a car-free Sunday is organised in many Belgian
cities and municipalities. Everyone is invited to discover their city or
municipality in a different way, thereby contributing to more sustainable mobility.
More information can be found on the following websites:
On Sunday 20 September 2026, no traffic will be allowed in any of the 19 Brussels municipalities. The Brussels-Capital Region will thereby become the largest car-free zone in Europe.
In the table below you can follow the evolution of the concentrations of a number of pollutants during the
car-free Sunday of 20 September 2026. To be able to assess the effect of the car-free Sunday on air quality,
we also show the concentrations on a "normal" Sunday (i.e. average concentrations measured on the two Sundays
before the car-free Sunday) and the concentrations on a weekday (i.e. average concentrations during the weekdays
in the two-week period before the car-free Sunday).
For each measuring site, the results are shown
as a table (click on )
or as a graph per pollutant (click on
).
NOTE: interpreting the measurements is not always straightforward. More information can be found at
the bottom of this page.
| Region | Code | Municipality | All Pollutants | NO | NO2 | CO | O3 | PM10 | PM2.5 | BC |
| Brussels | Dense built-up area with heavy traffic | |||||||||
| 41R002 | Ixelles |
|
|
|
|
|||||
| 41B008 | Brussels (Belliard) |
|
|
|
|
|||||
| 41B001 | Brussels (Arts-Loi) |
|
|
|
||||||
| 41CHA1 | Brussels (Ganshoren) |
|
|
|
||||||
| 41REG1 | Brussels (Regentlaan) |
|
|
|
||||||
| Residential area | ||||||||||
| 41R012 | Uccle |
|
|
|
|
|
|
|
||
| 41B011 | Berchem-Sainte-Agathe |
|
|
|
|
|
||||
| Industrial area | ||||||||||
| 41N043 | Haren |
|
|
|
|
|
|
|||
| 41MEU1 | Neder-Over-Heembeek |
|
|
|
|
|
||||
| Central urban area | ||||||||||
| 41R001 | Molenbeek |
|
|
|
|
|
|
|
|
|
| 41B004 | Sainte-Catherine |
|
|
|
||||||
| 41B006 | Brussels (EU Parliament) |
|
|
|
|
|||||
| Flanders | 42R801 | Borgerhout (Antwerp) |
|
|
|
|
|
|
|
|
| 42R802 | Borgerhout-roadside (Antwerp) |
|
|
|
|
|
|
|||
| 44R701 | Ghent |
|
|
|
|
|
|
|
||
| 42R020 | Vilvoorde (*) |
|
|
|
|
|
||||
How should the measurements be interpreted?
In the zones where motorised traffic is not allowed, air quality will improve compared to the situation with motorised traffic. However, concentrations during a car-free Sunday are not always, and not for every pollutant, lower than on an average Sunday.
Interpreting the results of the measurements on the car-free Sunday itself is not always straightforward. If, for example, the weather is warm and sunny (late) summer weather, there will in any case be more ozone than on an "average" Sunday. This is normal, since more ozone is simply formed when it is warm and sunny. A temporary, sizeable drop in traffic emissions will not result in less ozone. Moreover, if there is also little wind, or long-range import, particulate matter concentrations can also be higher than on an average Sunday.
The impact of the car-free Sunday on air pollution is therefore not always easy to determine. The measured concentrations are indeed not only determined by local emissions from road traffic, but also by meteorological conditions and the transport of air pollution from surrounding cities, regions and countries.
For a scientifically correct comparison, the situation on the car-free Sunday (i.e. the
situation without traffic) would need to be compared with the situation on the same day of
the year, under the same weather conditions, but WITH traffic. This comparison is not
possible on the basis of measurements from a single Sunday, but it can be done using computer
models.
The impact of car-free Sundays on air quality has been examined in this scientific study:
https://www.sciencedirect.com/science/article/pii/S2214140524001993
Impact of the car-free Sunday based on measurements from the past 10 years
By comparing the measurements taken during the car-free Sundays of the last 10 years (period 2016–2025) with the measurements from the same period on the 2 Sundays before and the 2 Sundays after the car-free Sunday, the meteorological effects are averaged out to some extent, making it possible to estimate the effect of the car-free Sunday on air quality. The figures below show the effect on nitrogen dioxide (NO2) and particulate matter (PM2.5) concentrations, based on the measurements at all Brussels measuring stations and, for NO2, also at the busiest traffic locations.
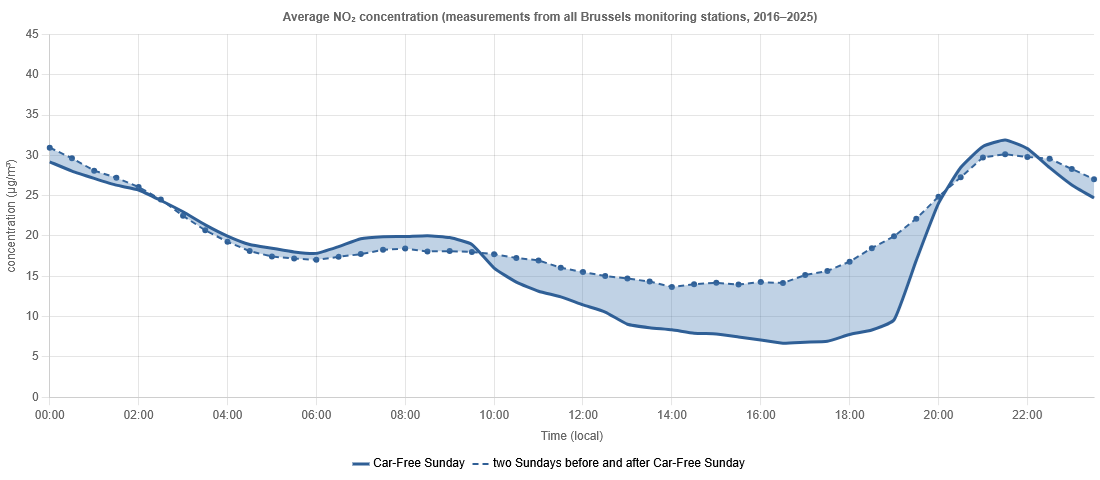
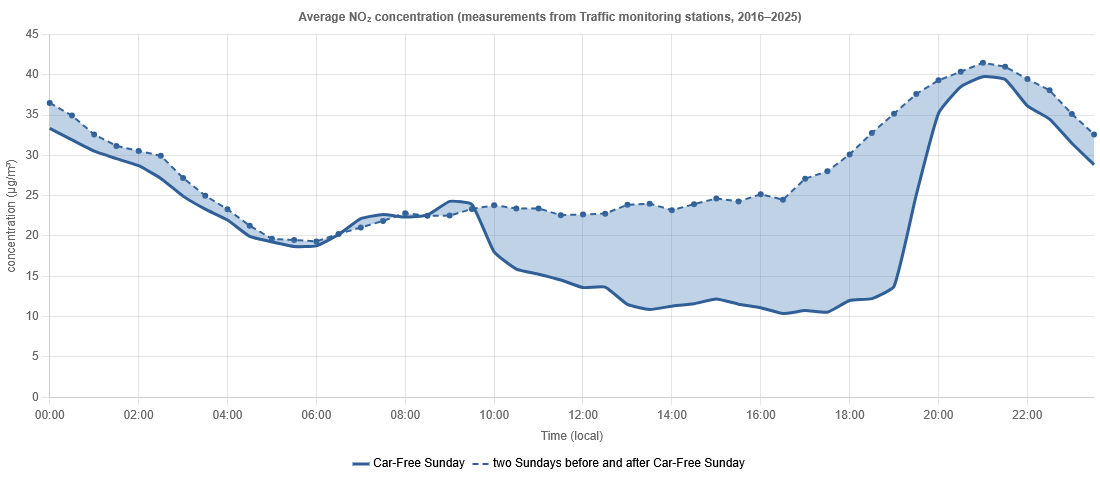
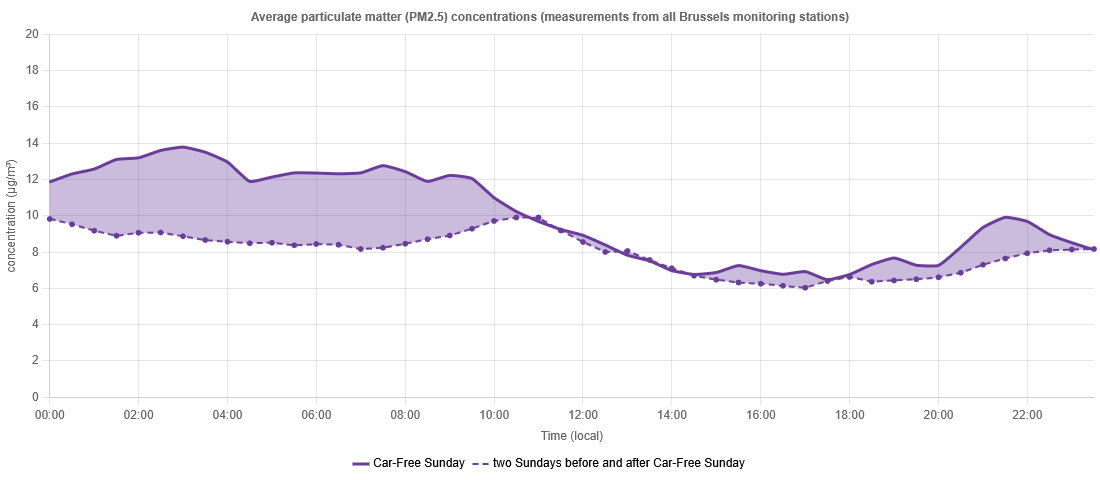
Based on this, we can conclude the following:
More information on air quality can be found on the websites of IRCEL, VMM and Brussels Environment