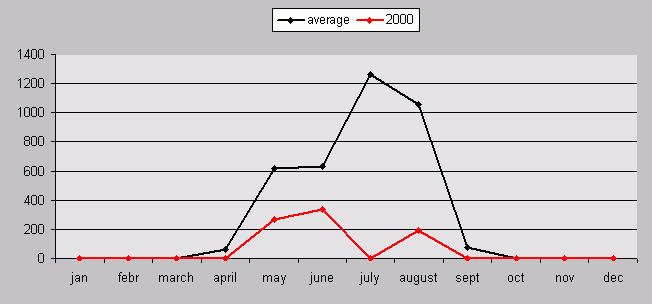
Ozone in Belgium : country average of AOT60ppb by the daily maximal 8h-average
AOT60ppb : accumulated excess of the daily maximal 8h-average above 120 µg/m³ (expressed in µg/m³.hours)
This is the cumulative excess above the threshold value of 120 µg/m³ , i.e. the measuring of the excess of ozone concentration over all days above 120 µg/m³ ( = the positive difference between the daily maximal 8h-average concentration and the threshold value of 120 µg/m³) multiplied by the duration (hours). The excess is expressed in µg/m³.hours.
The value is obtained by calculating the positive surplus per 5 x 5 square kilometers daily and then averaging these results spatially over Belgium and adding them for the year.
The ozone exess is a measurement for the exceeding volume in Belgium. This indicator takes into account the scope and duration of the exceeding incidents. Furthermore, as it is averaged spatially, it is a large extent independent of the number of monitoring stations, so it can serve as a standard in comparisons between different periods and regions.
for spatial representation, click on year
![]()
year |
jan |
febr |
march |
april |
may |
june |
july |
august |
sept |
oct |
nov |
dec |
sum |
1987* |
0 |
0 |
0 |
203 |
37 |
15 |
954 |
91 |
73 |
0 |
0 |
0 |
1372 |
1988* |
0 |
0 |
0 |
10 |
38 |
23 |
0 |
786 |
23 |
0 |
0 |
0 |
881 |
1989* |
0 |
0 |
0 |
13 |
2003 |
1575 |
1819 |
930 |
246 |
0 |
0 |
0 |
6586 |
1990* |
0 |
0 |
6 |
277 |
1842 |
1021 |
3082 |
3299 |
0 |
0 |
0 |
0 |
9527 |
1991* |
0 |
0 |
0 |
35 |
12 |
0 |
754 |
32 |
206 |
0 |
0 |
0 |
1038 |
0 |
0 |
0 |
10 |
666 |
934 |
739 |
477 |
0 |
0 |
0 |
0 |
2827 |
|
0 |
0 |
0 |
161 |
295 |
1502 |
528 |
10 |
0 |
0 |
0 |
0 |
2495 |
|
0 |
0 |
0 |
4 |
21 |
719 |
4066 |
473 |
0 |
0 |
0 |
0 |
5283 |
|
0 |
0 |
0 |
0 |
1568 |
415 |
2992 |
3074 |
0 |
0 |
0 |
0 |
8049 |
|
0 |
0 |
1 |
87 |
11 |
996 |
882 |
743 |
0 |
0 |
0 |
0 |
2720 |
|
0 |
0 |
0 |
22 |
257 |
533 |
366 |
3022 |
7 |
0 |
0 |
0 |
4207 |
|
0 |
0 |
31 |
0 |
1274 |
63 |
85 |
1137 |
0 |
0 |
0 |
0 |
2589 |
|
0 |
0 |
0 |
8 |
343 |
682 |
1400 |
575 |
487 |
0 |
0 |
0 |
3496 |
|
| 0 | 0 | 0 | 9 | 270 | 337 | 0 | 194 | 0 | 0 | 0 | 0 | 801 | |
average |
0 |
0 |
3 |
59 |
617 |
630 |
1262 |
1060 |
74 |
0 |
0 |
0 |
3928 |
average since 96 |
0 |
0 |
6 |
23 |
431 |
522 |
547 |
1134 |
99 |
0 |
0 |
0 |
4212 |
(* not enough operational ozone stations for
reliable spatial representation)
